




 CubeApp


A brain on the edge. A twin in the cloud.
The CubeBridge is an industrial edge server inside each container. It runs the CubeCore agent that reads every device, controls the container autonomously and keeps working during internet loss. It synchronises with CubeTwin, the cloud portal where operators control the fleet and clients follow their own containers.
Four problems every remote data center has. One platform that solves them.
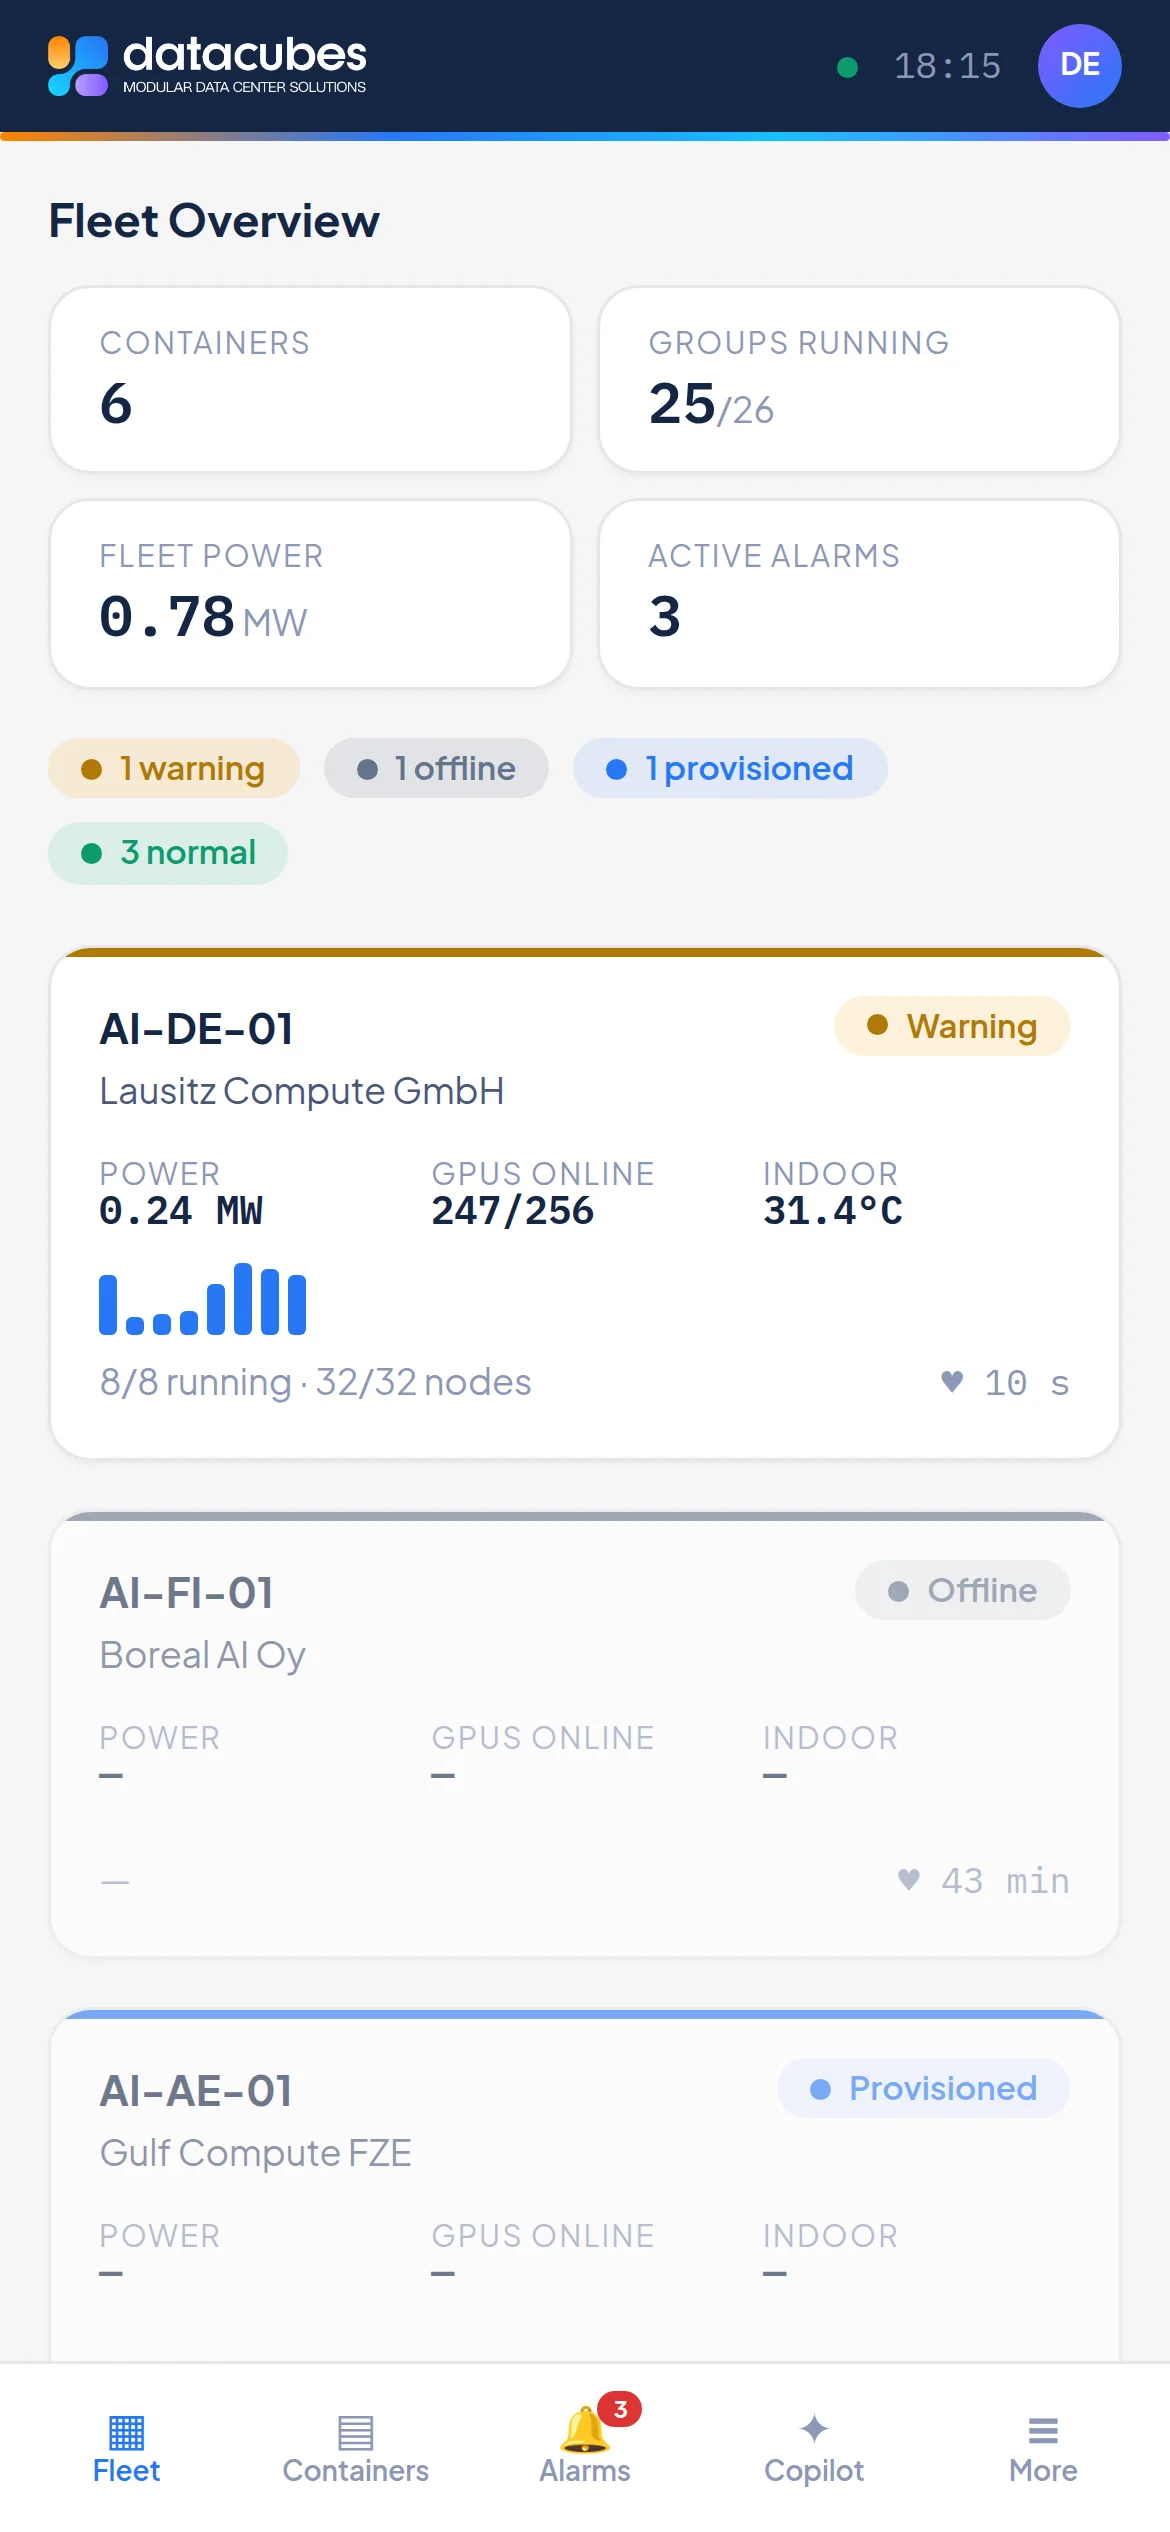
Containers stand where power is cheap, not where people are. Every value, every camera and every switch is in one portal, on desktop and on the phone, down to 360 px.
The internet link to a remote site is the weakest part. The edge agent keeps running the container on its own during an outage, buffers every reading locally and backfills the cloud when the link returns. Nothing is lost, nothing stops.
A fixed priority order that software cannot bypass: critical safety shutdown, PLC safety logic, manual emergency stop, Datacubes manual control, grid signal, rotation, normal operation. AI advises, AI never controls.
Everything is logged: who, when, why, previous and new state. Every client sees only their own containers, read-only, in a Datacubes-branded portal with exports for their own reporting.
Built like industrial control software, not like a dashboard.
A new container of any type is a configuration file and a commissioning run. A test in the build fails if a site-specific value lands in code.
The bridge declares which modules it has. The portal composes its screens from that list: what a container does not have renders no tab, no card and no placeholder.
The orchestrator is pure, unit-tested code. It runs on site and keeps running without internet.
Only compute groups and, where a site explicitly opts in, PDU outlets are ever commanded. PLC, air conditioning, drives, security hub, network, cameras and rack sensors are observed, never touched.
A dead camera, PDU or cloud API never delays a control tick.
A device that does not answer becomes a visible "unavailable" reading, never a gap that looks like zero. Stale values are dropped rather than shown as live.
All features.
Three roles: admin, operator (scoped to assigned containers) and client (read-only, own organisation only). Every screen adapts to the modules the container declares. All times stored in UTC, shown in the viewer's zone.
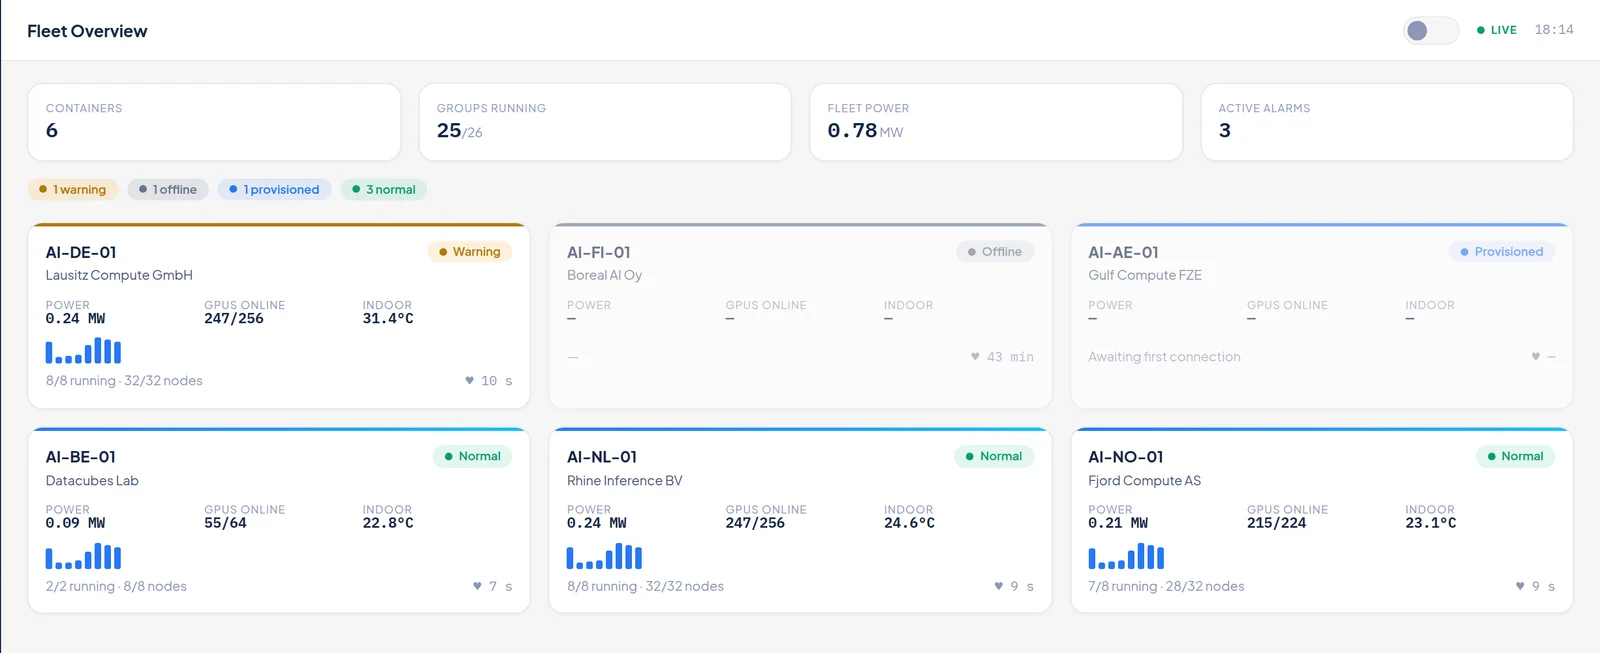
The whole fleet on one screen.
Four KPI cards: containers, groups running, fleet power, active alarms. One card per container with status, client, power, indoor temperature, a real 2-hour sparkline, groups and nodes active and heartbeat age. Problems float to the top. Silent refresh every 10 seconds; a freshly onboarded container shows "awaiting first connection" instead of numbers.
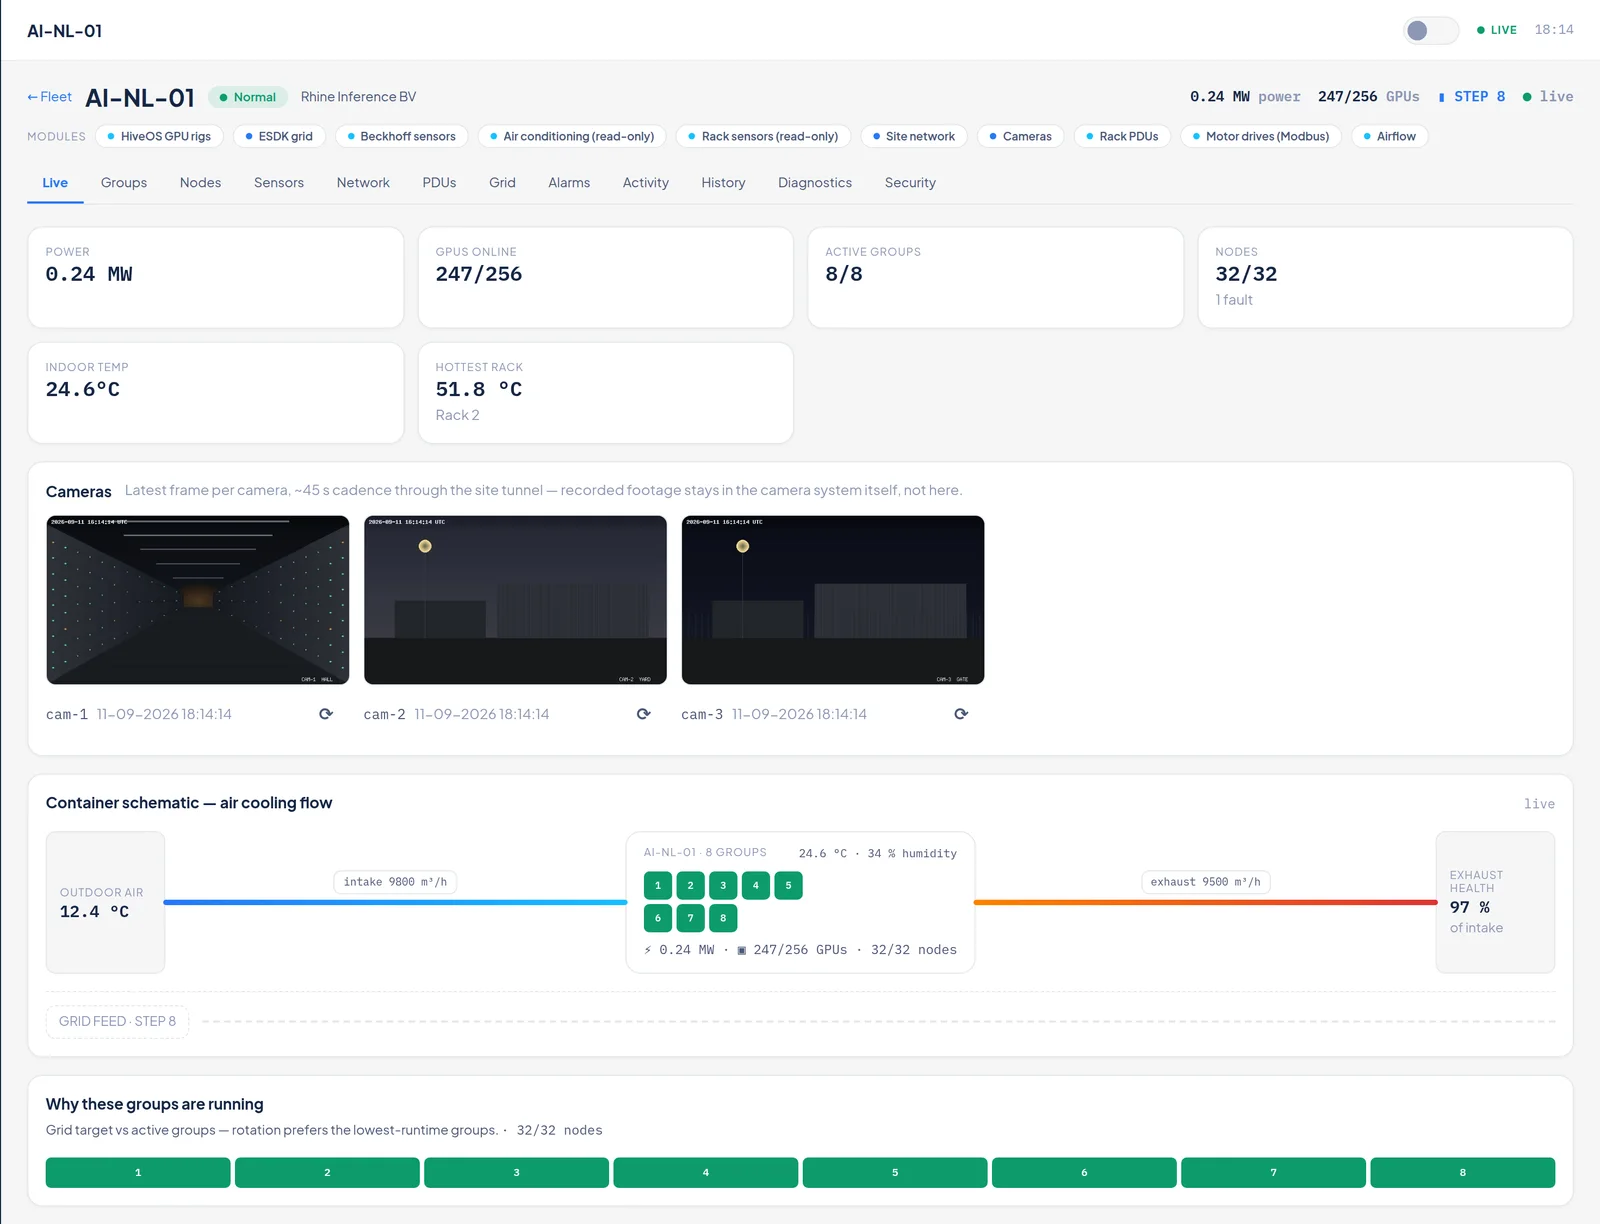
A container in one view, with live camera frames.
Power with an honest fallback to the PDU sum when there is no meter, compute groups, nodes with an issue line, indoor temperature and hottest rack. Camera wall with the latest frame per camera and a zoom lightbox. Security-system card, airflow schematic from outdoor air to exhaust, loadbank card, rack-temperature meters, the five worst active alarms and the "why these groups are running" decision strip.
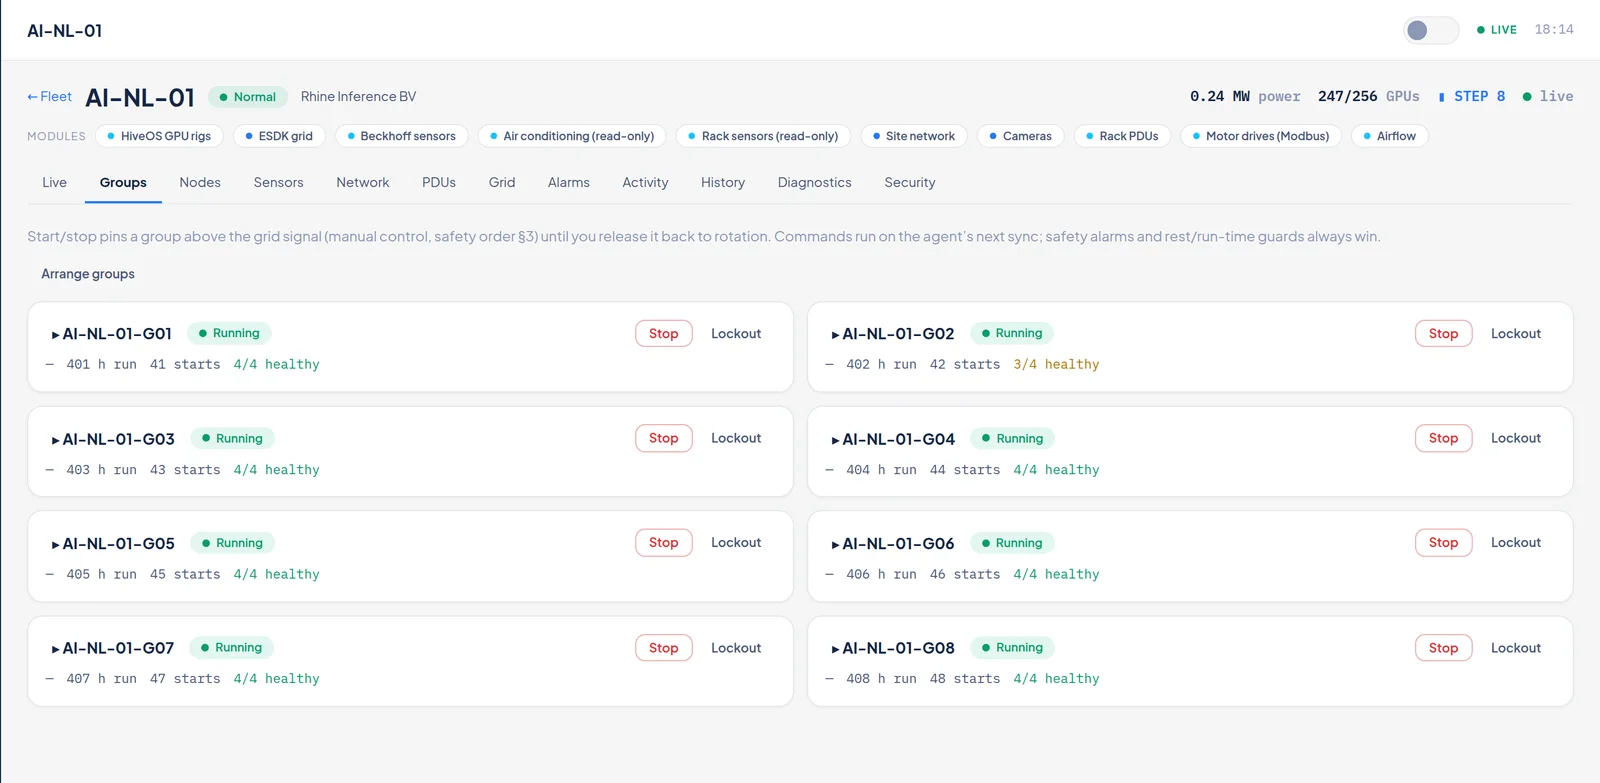
Compute groups, with control for staff.
One card per group: state, lockout and manual-pin badges, power, runtime, starts, healthy versus total nodes, and a node tile grid. Manual control for staff: start, stop, release, lockout, each behind a confirmation with a reason that lands in the log. Start is refused during a critical safety state, with the reason on screen. A drag-and-drop editor moves nodes between groups; the bridge applies it on its next sync.
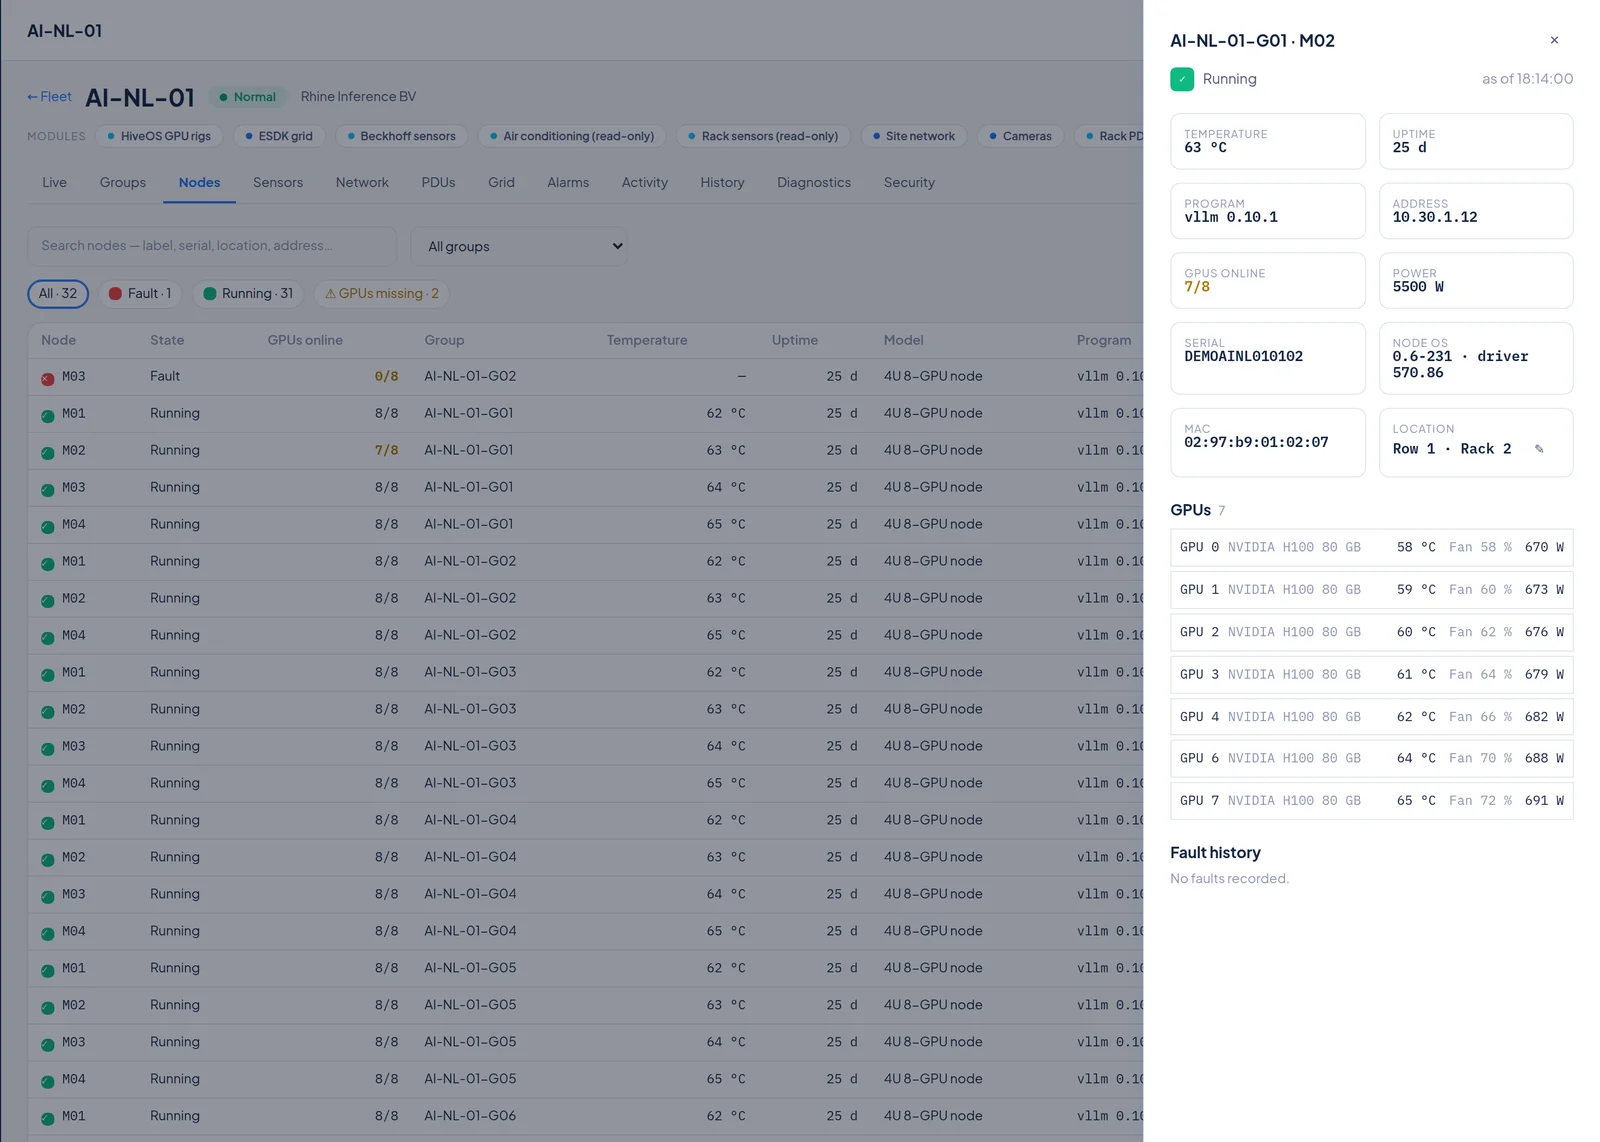
Every machine in one table.
Search, group filter, state chips, a degraded-hardware filter and model and firmware mix chips. The node drawer shows temperature, uptime, firmware, address, GPUs alive, watts, serial, fans, the switch port it hangs on, its physical location, a 24-hour sparkline and the fault history. The drawer follows the live poll.
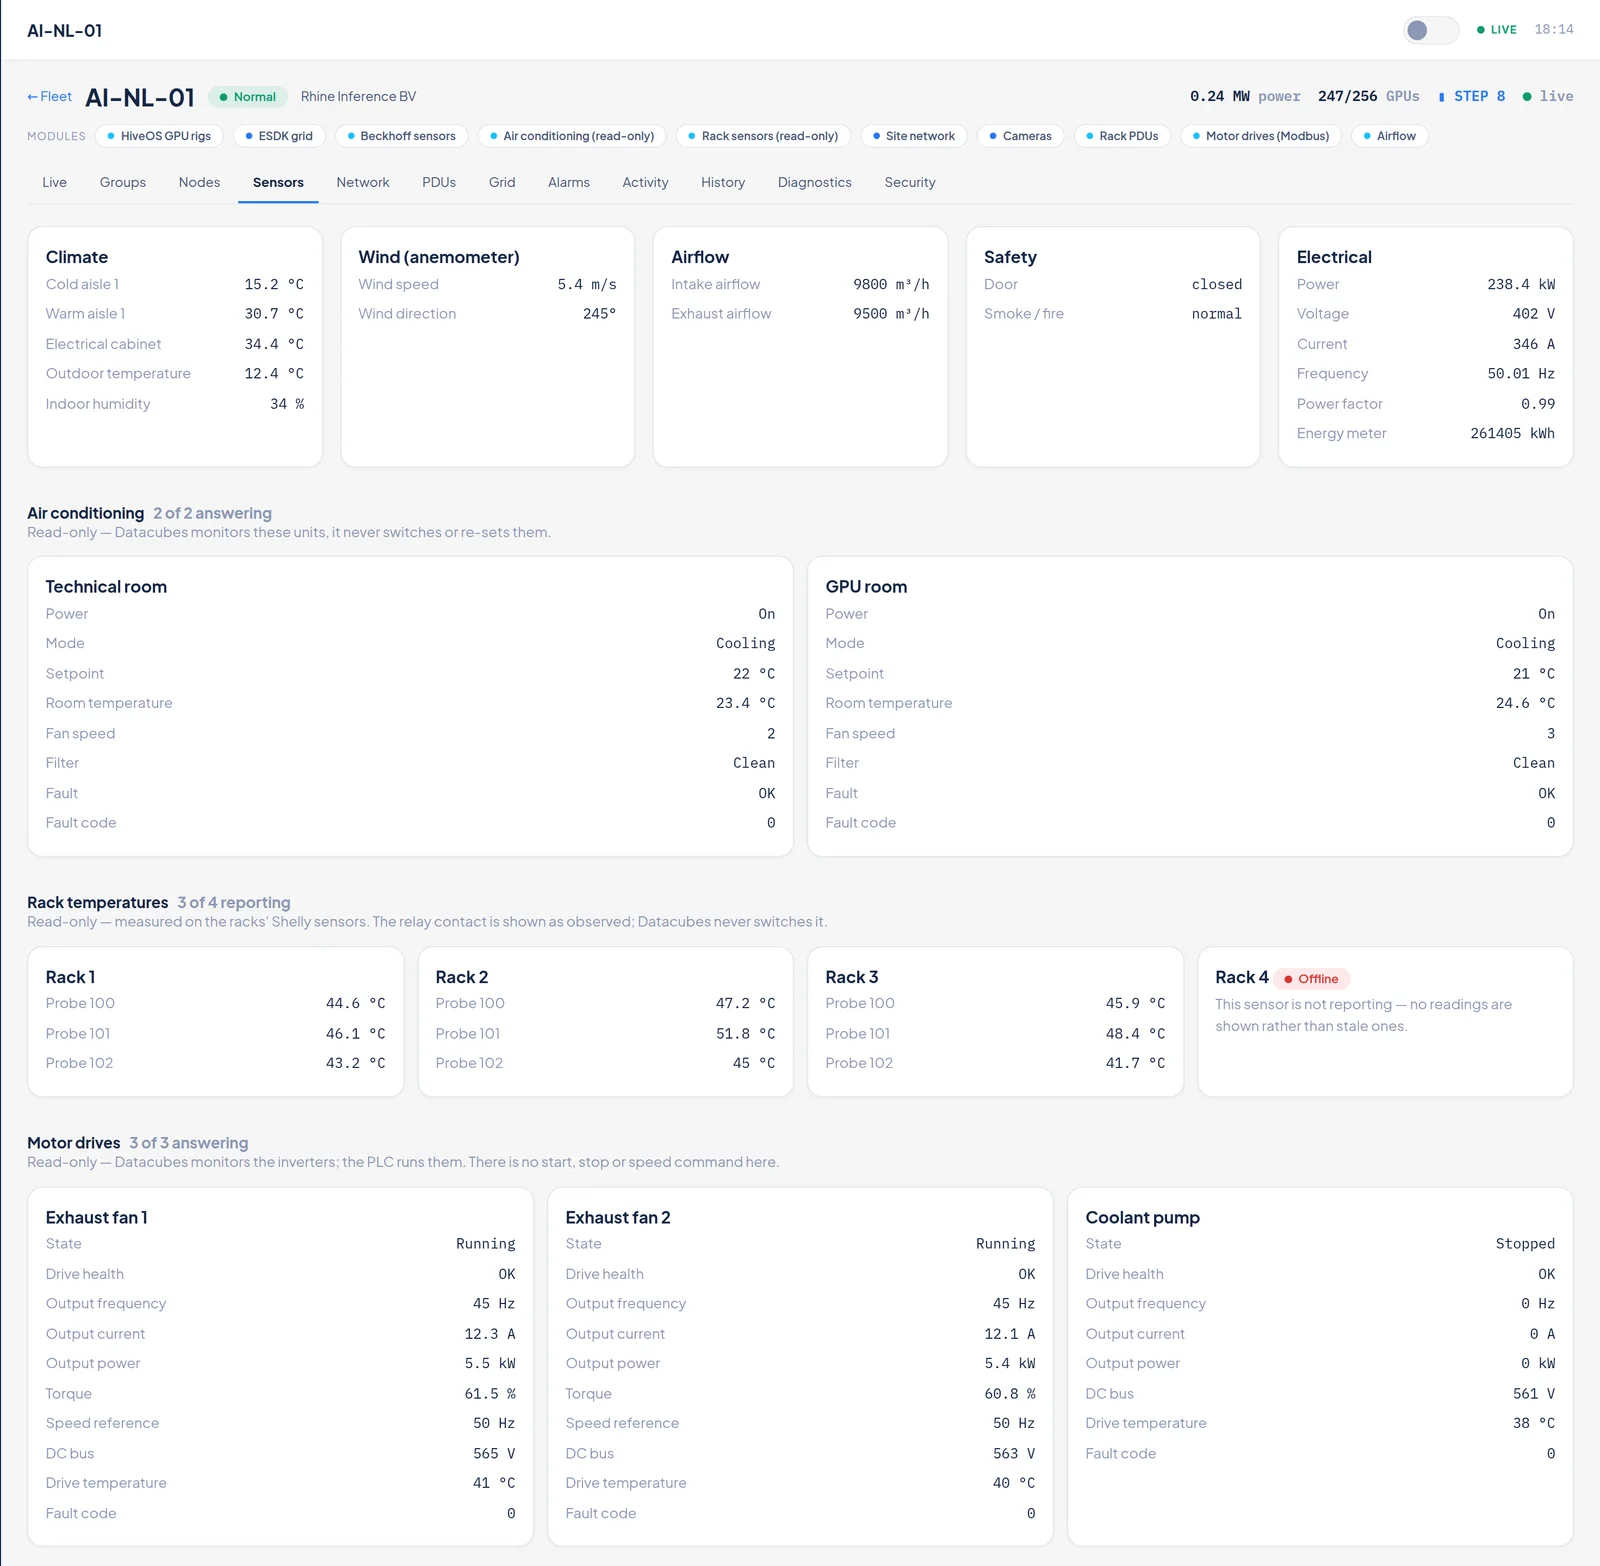
Climate, airflow, safety, electrical.
Cold and warm aisle, intake and exhaust airflow, door and smoke, voltage, current, frequency, power factor and energy. Air-conditioning units, rack probes and motor drives read out over Modbus, one card each, built from the points the site declares, with explicit read-only notes.
Power down to the outlet.
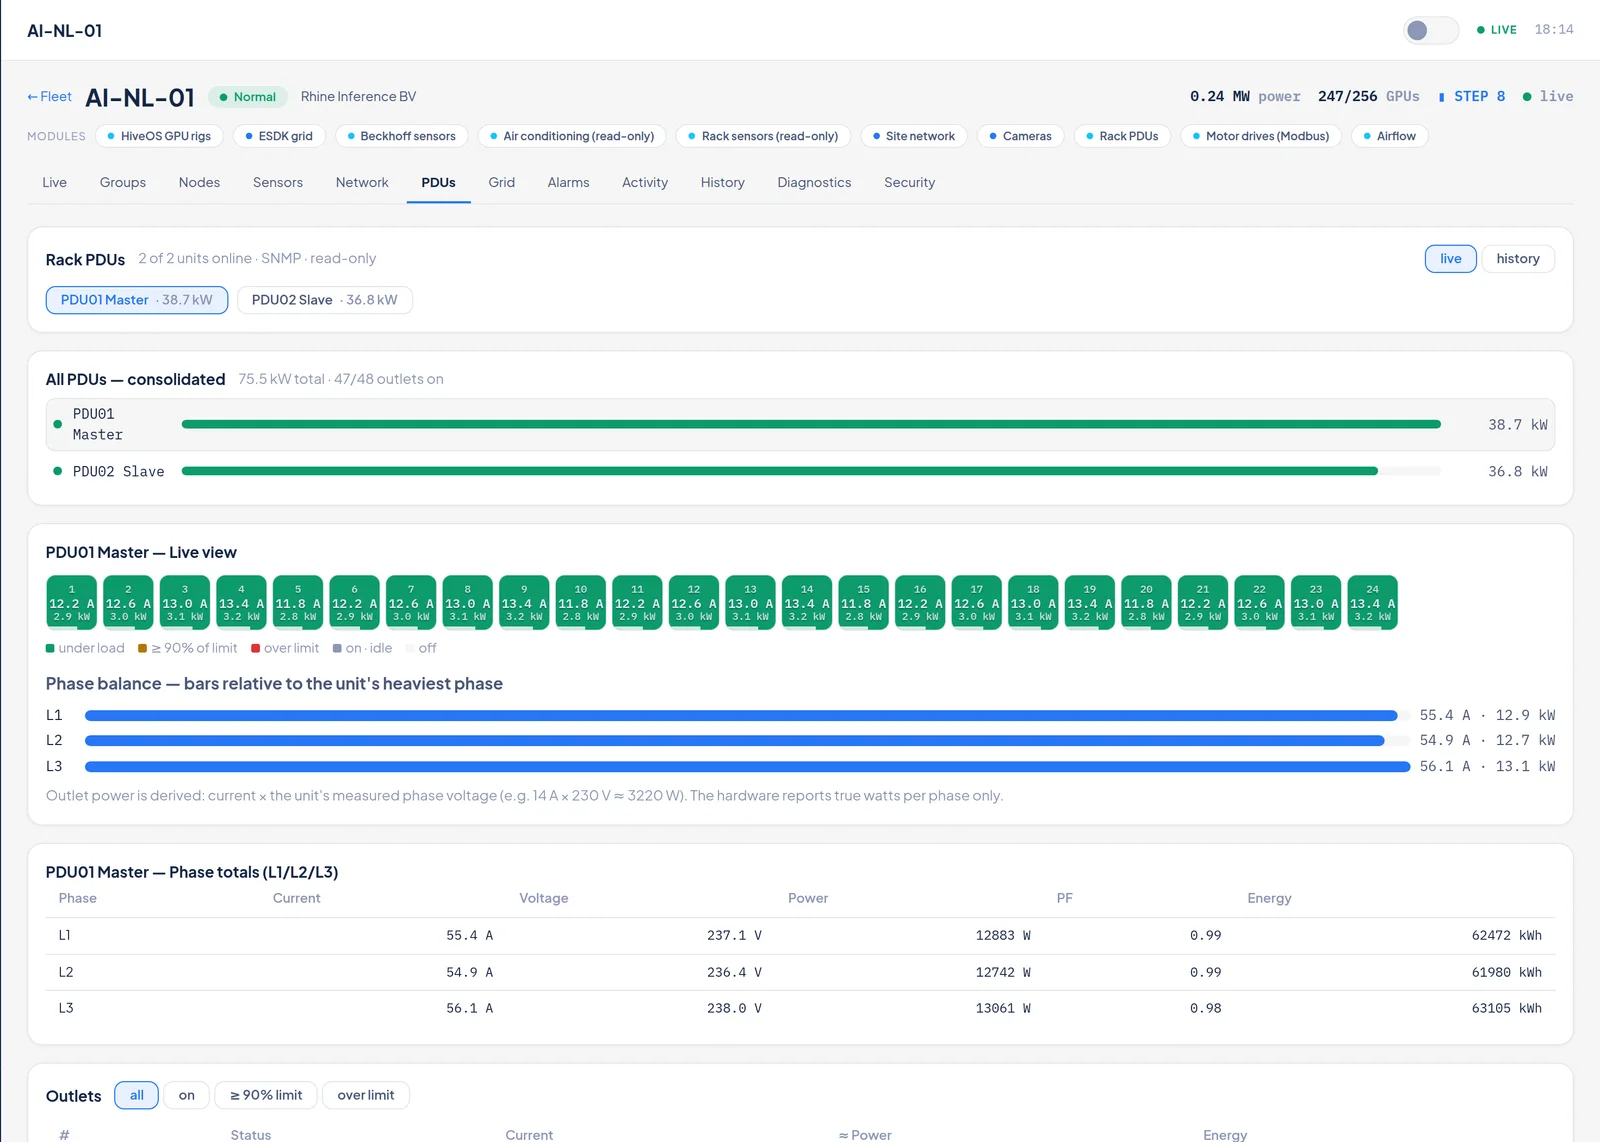
Unit picker for master and chain, a virtual PDU strip with one socket per outlet tinted by load against the breaker limit, phase balance, an outlets table and PDU history from 24 hours to 12 months. Outlet switching is an opt-in per site: turn on, off, power-cycle, or a graceful sequence for a whole PDU, each with confirmation, reason, live countdown and an audited log. A 15-second PSU rest is enforced and every switch is read back.
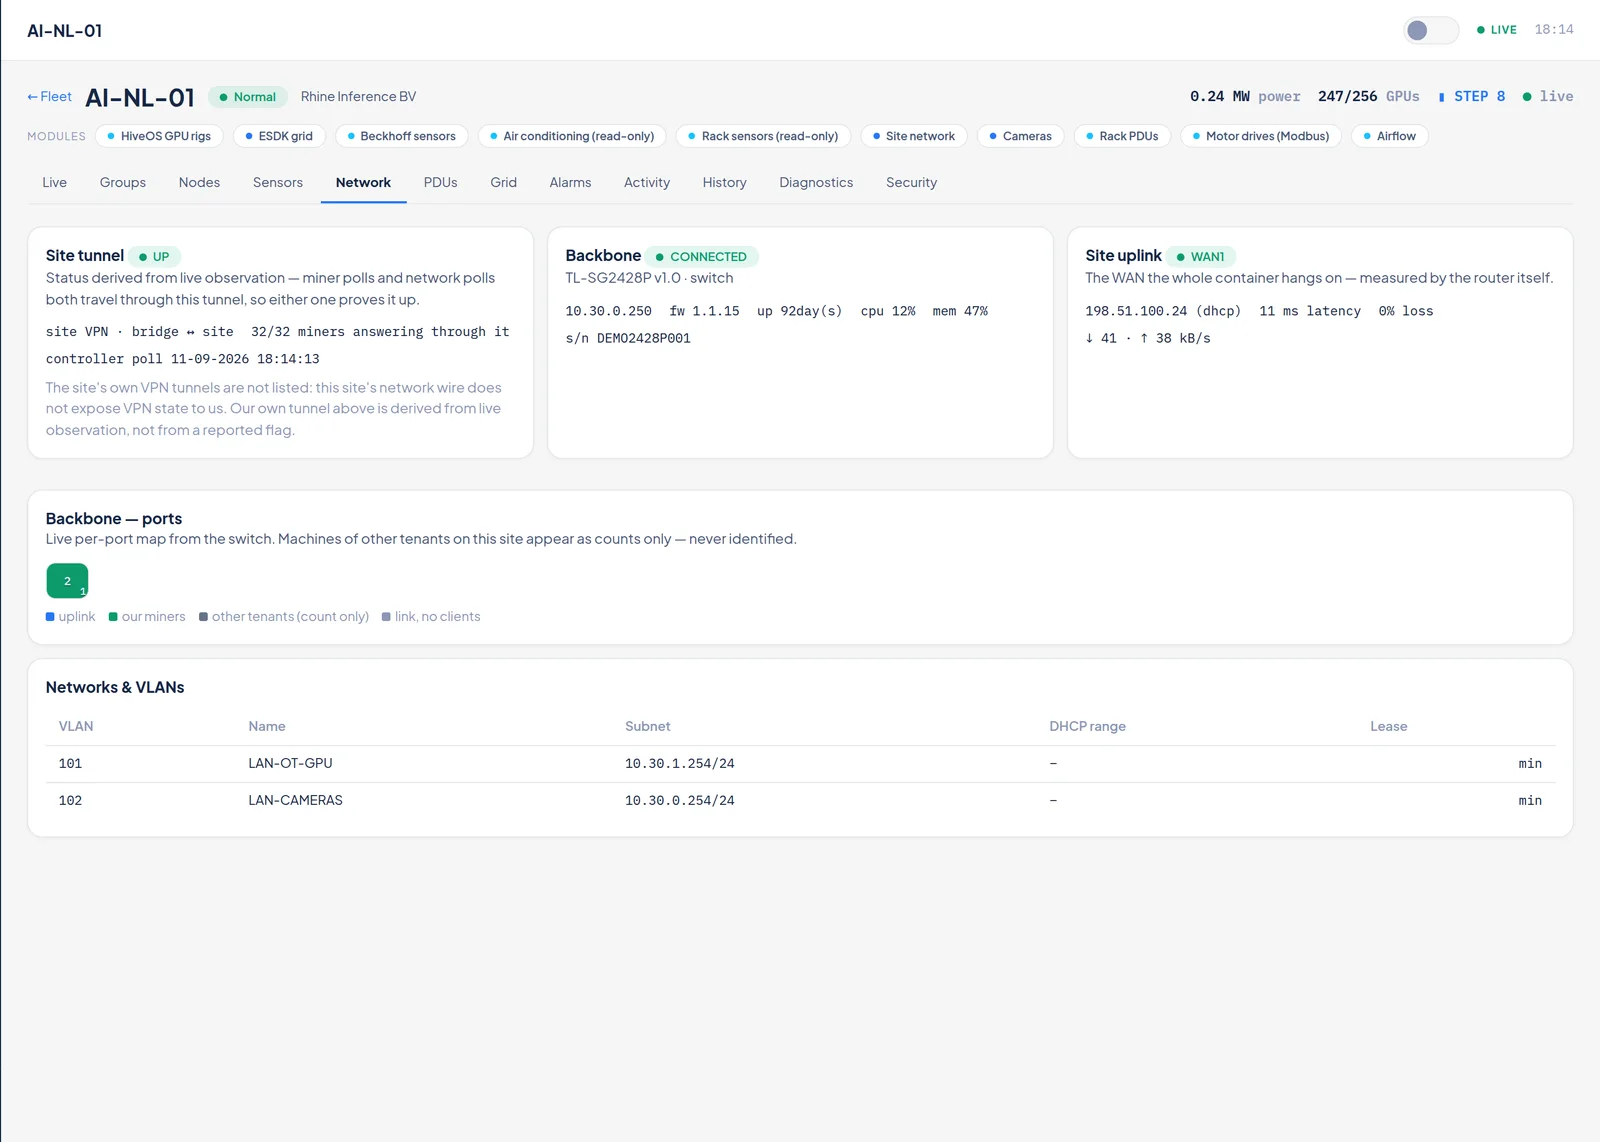
The site network as telemetry.
Site tunnel up or down from live observation, device cards with firmware-update badges, a WAN card with latency, loss and rates, a virtual switch with one tile per port tinted by role, Wi-Fi roll-up per access point and the VLAN table. Devices follow their MAC, so a replaced unit needs no reconfiguration. Read-only by construction.
What the grid asked, and what the container did.
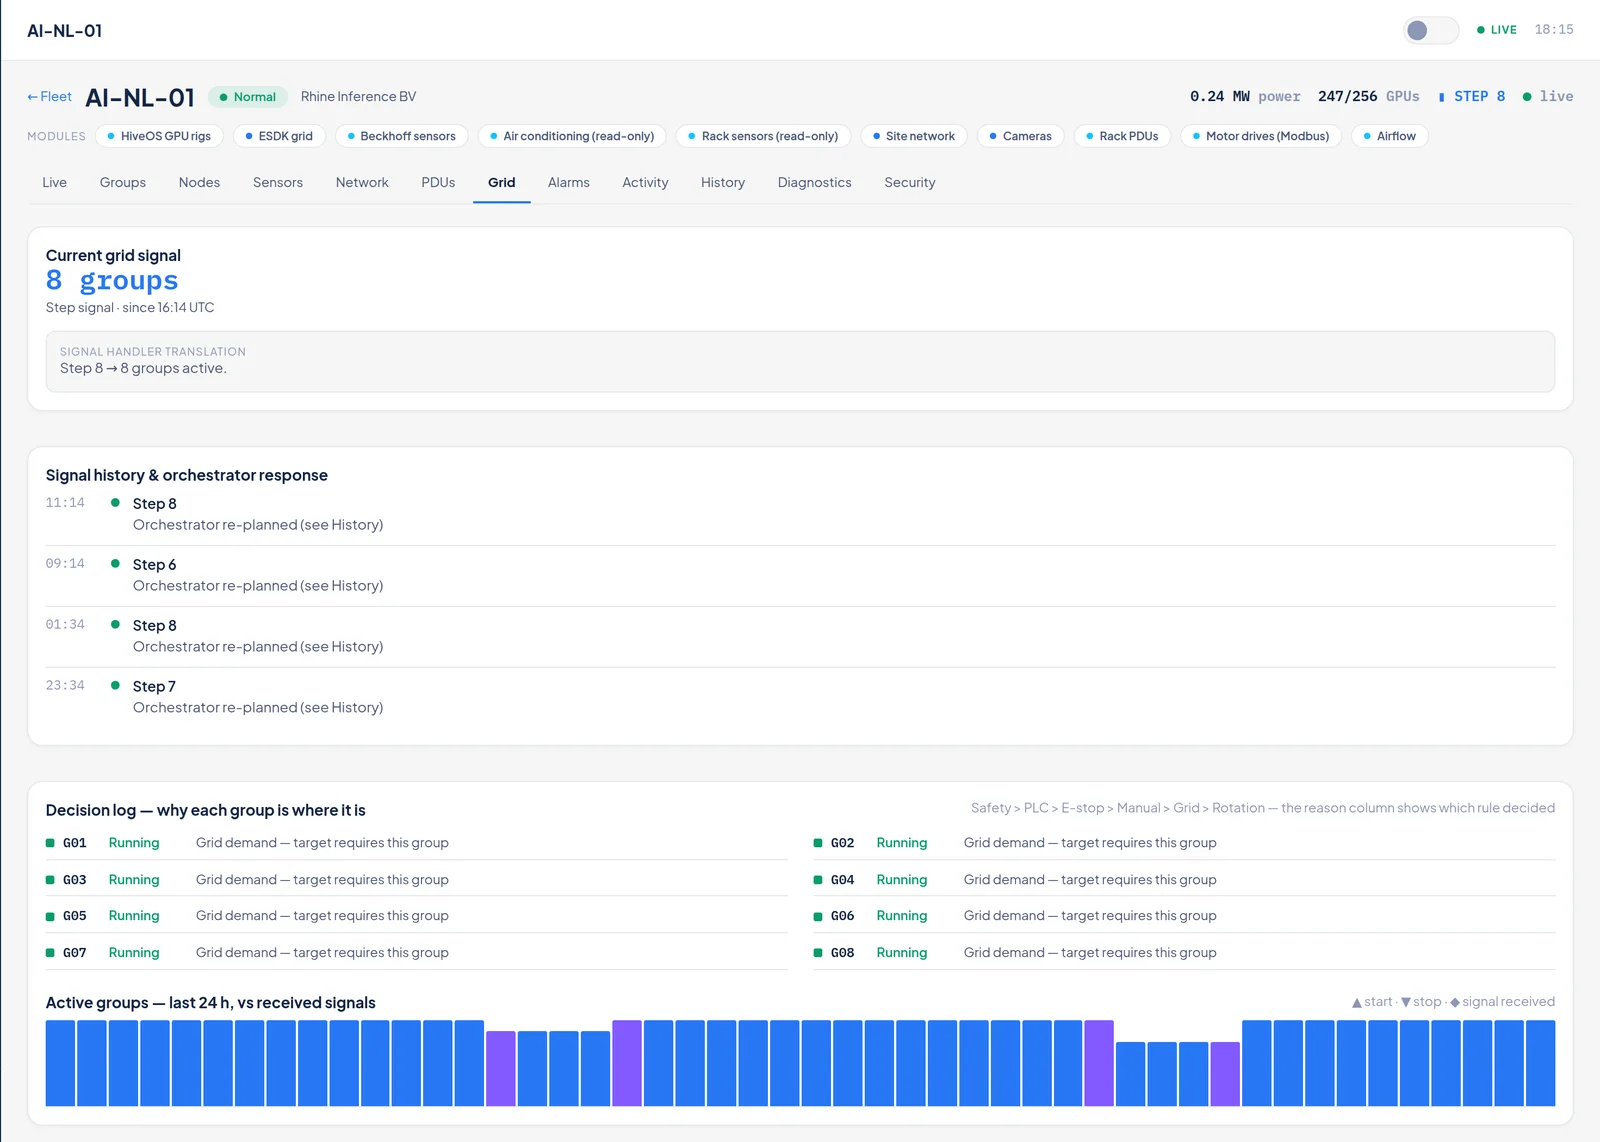
The current signal and its translation into a number of groups, the signal history with the orchestrator's response, the per-group decision log naming which rule of the safety order decided each state, and a 24-hour activity wave. Three signal forms: binary, stepped and target power.
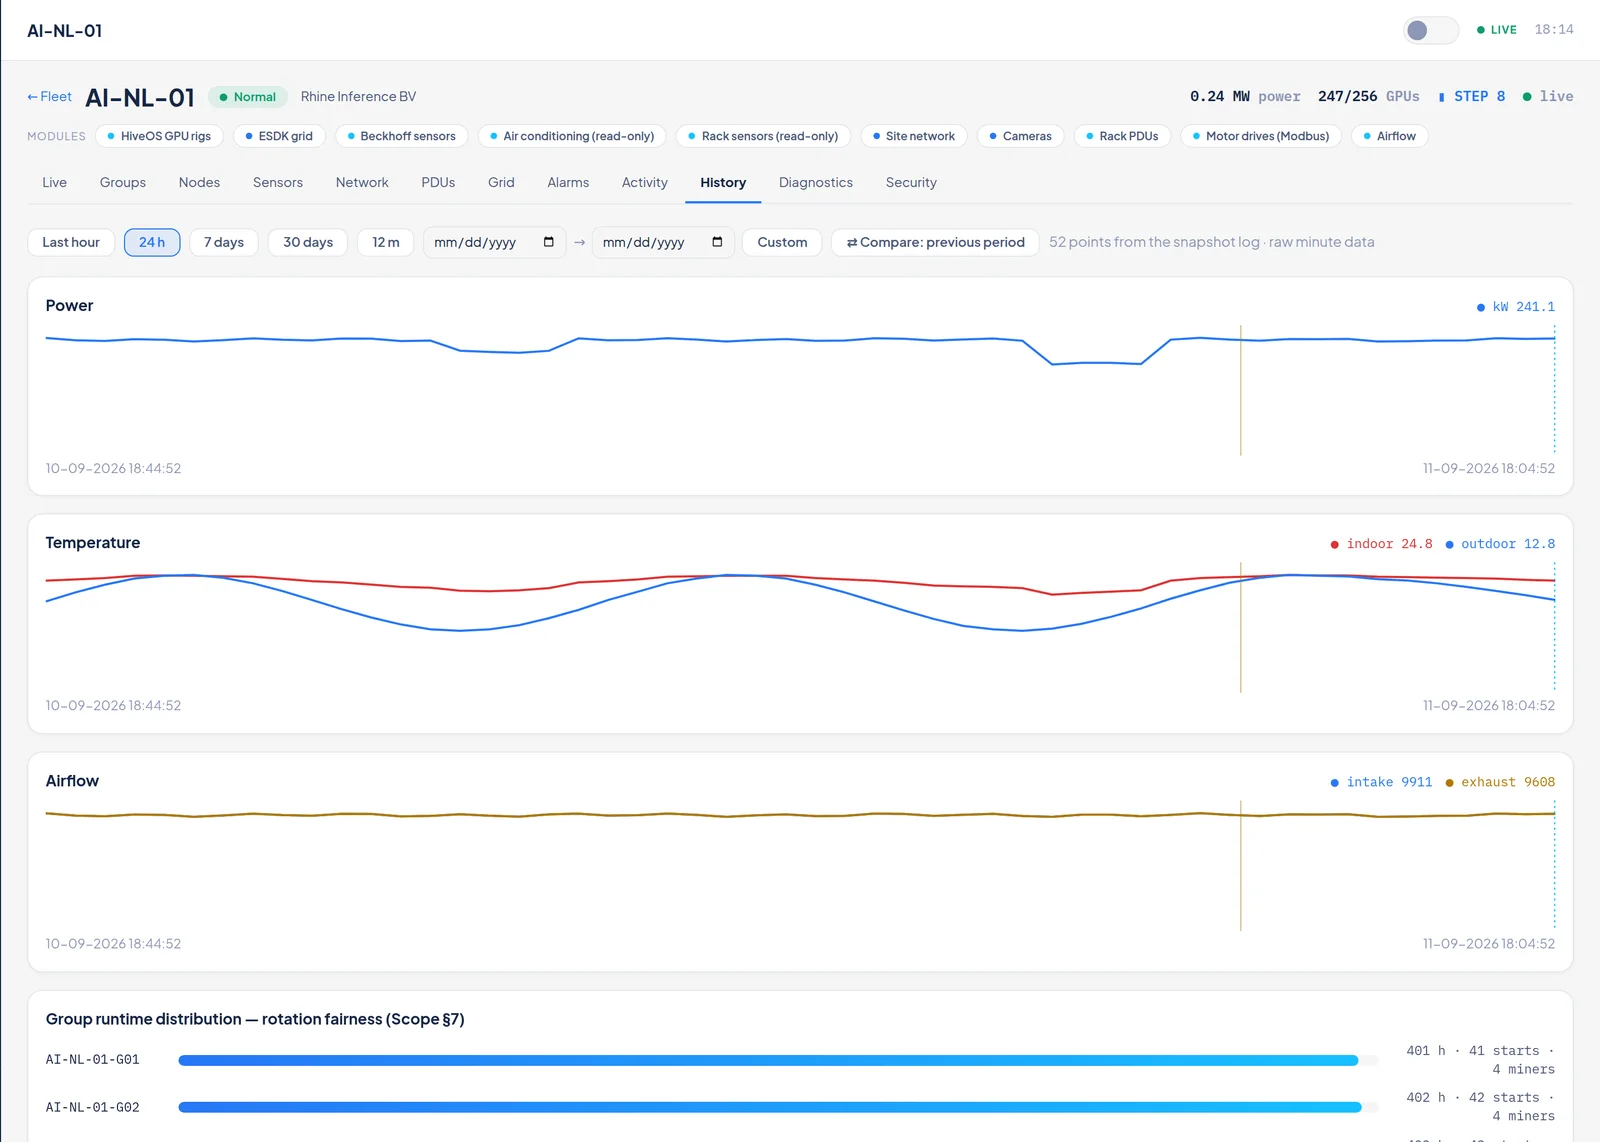
Minute data to yearly trends.
Ranges from 1 hour to 12 months and custom, with the previous period as a dashed overlay on the same scale. Power, temperature, airflow and the group-runtime distribution that makes rotation fairness visible. Alarm and command markers on the axis. Resolution stated on screen; raw minute data is only pruned once its hourly rollup exists.
The bridge itself, in plain sight.
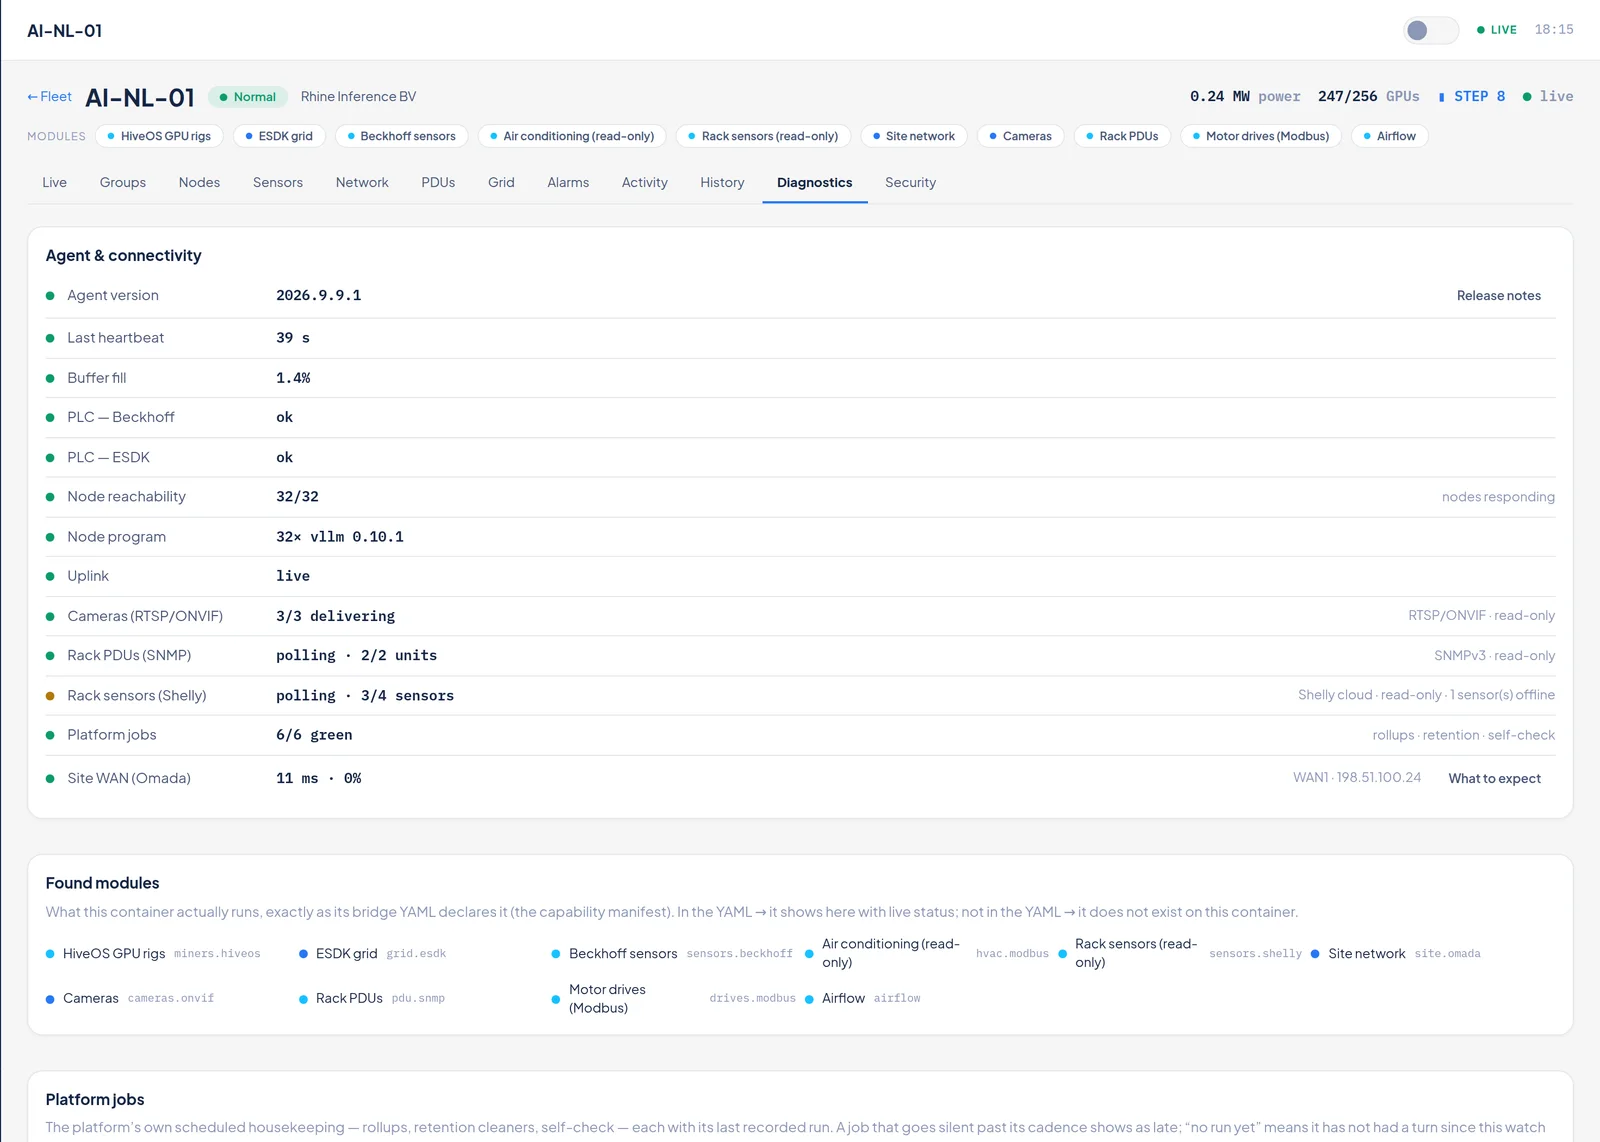
Per-module health straight from the capability manifest, bridge hardware health (disk, RAM, CPU, temperature, uptime), platform job status, the agent version linked to its release notes and replay from a timestamp with a progress bar. On the Security tab staff see the token fingerprint and can renew or revoke it with a reason, and pin the bridge's source address.
Thresholds are configuration, not code.
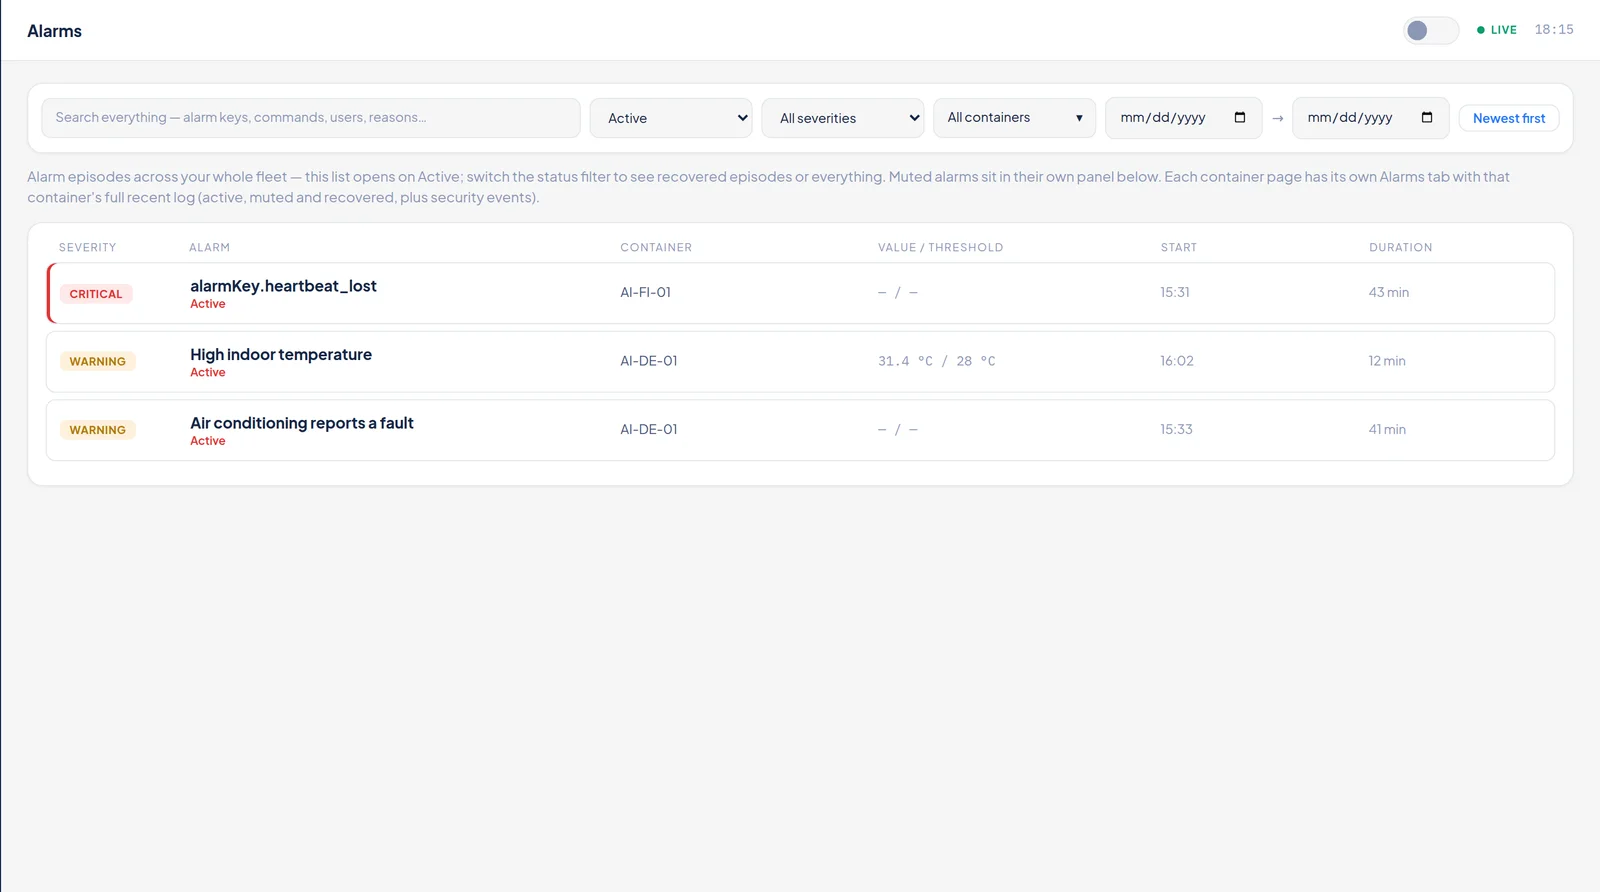
Fleet-wide list with filters kept in the URL, severity-hot active rows, interleaved security events and a muted-alarms panel. Severity, hysteresis and repeat interval are set per alarm and per container and pushed to the edge, so alarming survives an internet loss. Episodes fold raise and recover; an alarm-storm budget replaces a flood with one notice.
Analyse an alarm on request.
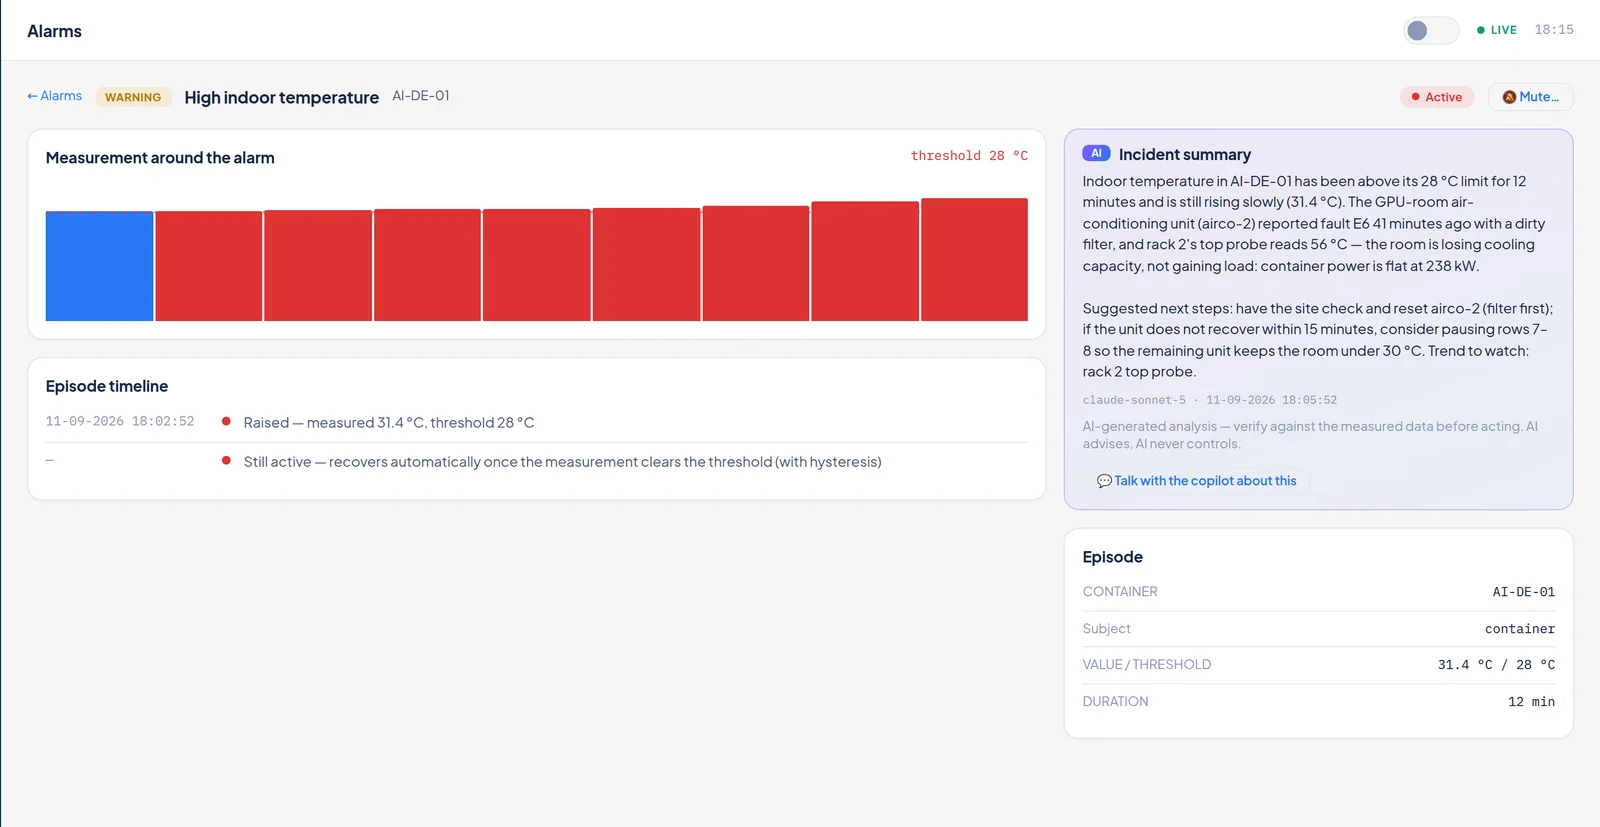
The measurement chart around the episode with the threshold line, the raise-to-recover timeline, the delivery log per recipient and channel, and mute with presets from one week to six months and a mandatory reason. The AI incident summary is written only when a person presses Analyse, is visibly marked as AI and never enters a notification.
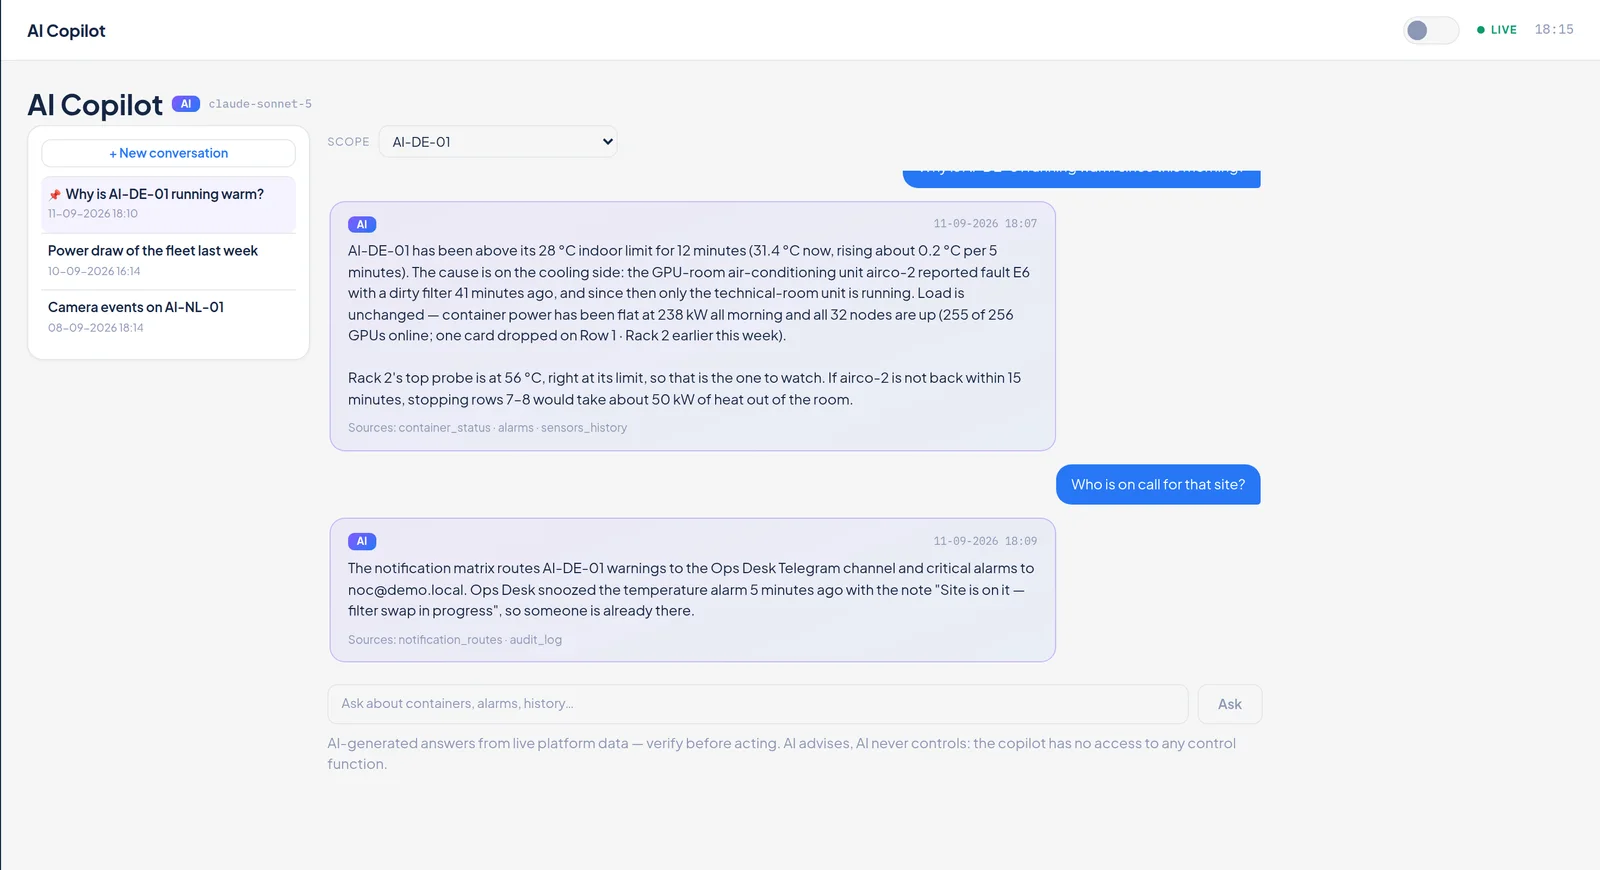
Ask the fleet a question.
Chat over live platform data, fleet-wide or scoped to one container, started from an alarm with the episode as context. Every answer lists the sources it queried. Read-only by construction: there is no write tool to misuse. It declines action requests and points at the control panel. Staff only.
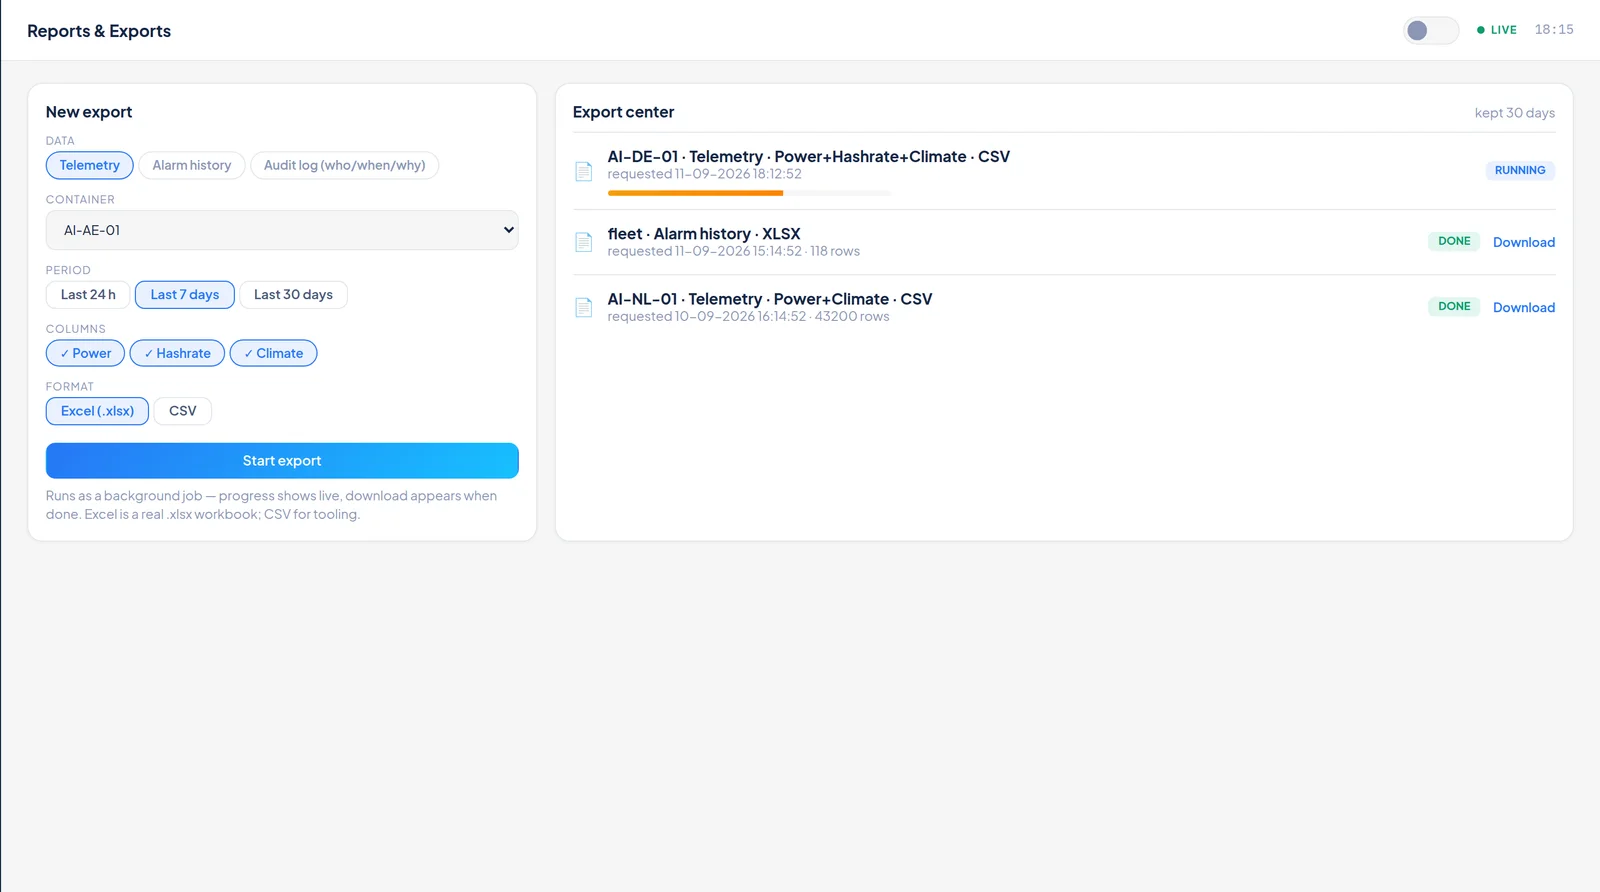
Excel and CSV, as a background job.
Telemetry with column choice, alarms and, for staff, the audit log, over 24 hours, 7 or 30 days. Runs as a background job with a live progress bar, download when ready, mail on completion. Scope frozen at request time and fully audited. Files age out after a configurable window.
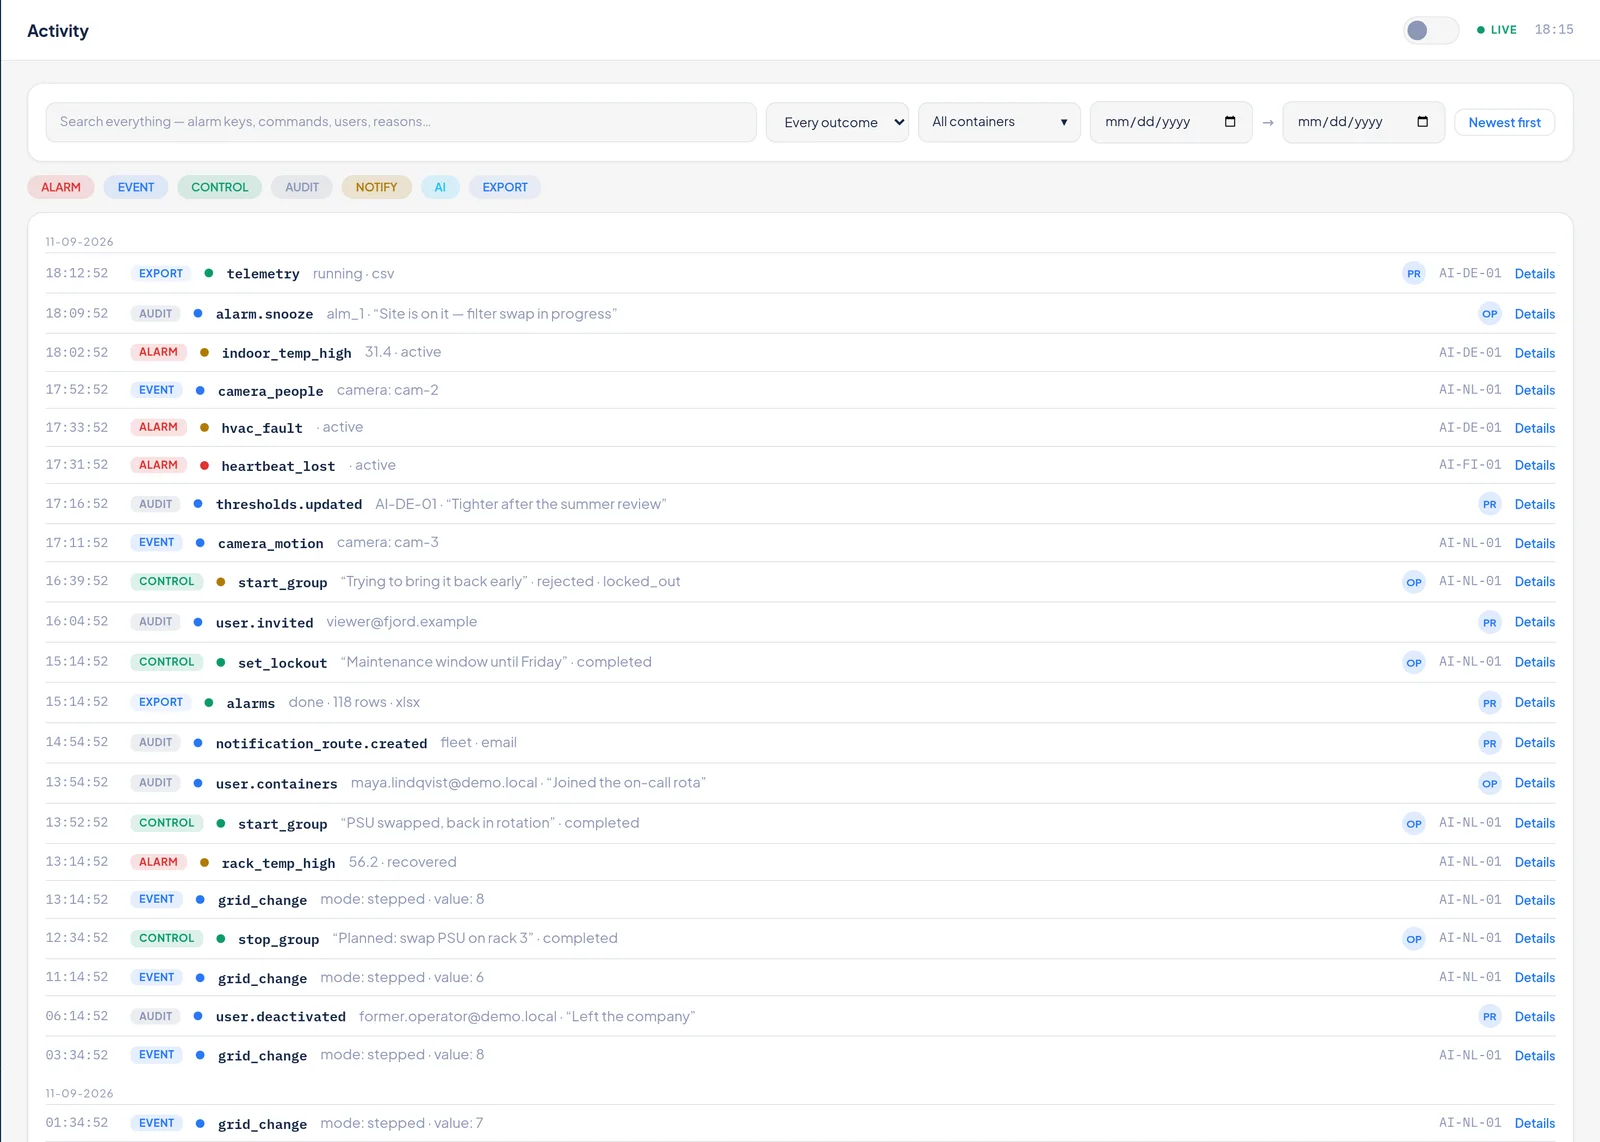
Every action, traceable.
One feed over everything that happens: alarms, events, control commands, audit entries, notifications, AI calls and exports. Filters by search, tone, container, date and category. Row detail with the facts, the raw payload and, for camera events, the frame burst of that moment. Clients see the feed for their own containers.
Eyes on hall, yard and gate.
One still per camera every 45 seconds through the site tunnel, latest frame only; recorded footage stays in the camera system. Camera events (people, intrusion, line-cross, tamper, motion) land in the alarm stream with a burst of five frames. Camera events are informational and never inhibit a start.

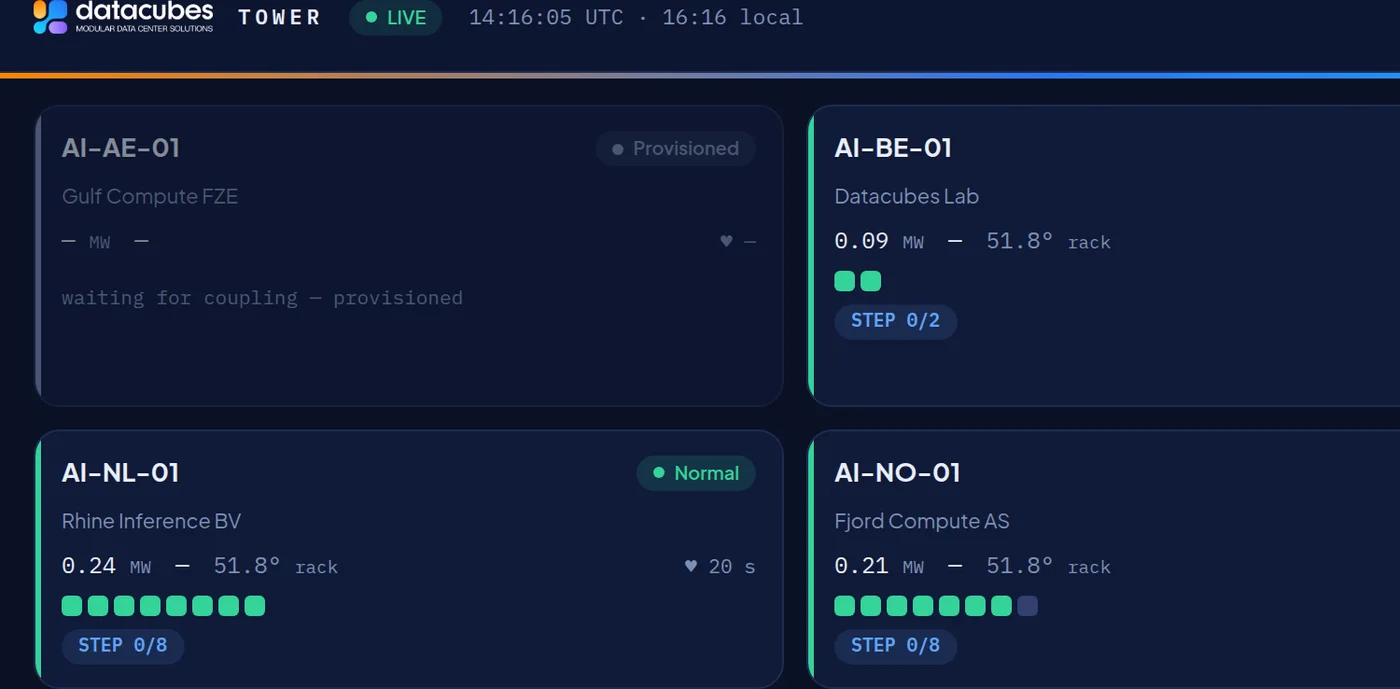
The control room wall.
An always-dark wall display for the whole fleet with baseline deltas, alarm counts, one tile per container and a live event ticker. The cockpit per container adds gauges for power against the committed target, energy, electrical, air in to out with the temperature delta, a heat-coloured node matrix, camera tiles and full history. Fullscreen, auto-cycle, keyboard shortcuts, watch-only.
The same platform, on site.
An installable web app with a bottom bar, usable down to 360 px with hit targets of at least 44 px. The service worker deliberately caches nothing: a control room must never see stale data. Light and dark theme; status colour always paired with text or a glyph.
Everything an operator and an admin need.
null
- Profile: date, time and zone preferences, Telegram linking with a test message, a personal channel-by-severity notification matrix, 2FA with recovery codes, install as app, every active session and trusted device with a revoke button.
- Users and clients: client organisations, invites by role, an operator's container checkboxes are its permission, reset 2FA, deactivate, hard delete behind a typed word and a reason.
- Thresholds: every alarm's value, severity, hysteresis and repeat interval, editable with a reason and pushed to the bridges.
- Notification recipients per container, channel and severity, with a coverage matrix that marks gaps in red.
- Containers and tokens: registry with agent version and last-used, settings, delete behind a triple lock with a live 2FA code.
- Settings: monthly AI budget and spend, outgoing mail, retention windows, and managed keys that are write-only.
- Onboarding wizard: identity, topology, thresholds from a template, network restriction; the token is shown exactly once and a live indicator turns green on the first heartbeat.
Every device in the container, one module each.
The bridge reads everything and controls almost nothing. That is a decision, not a limitation.
Reads per-node state, temperatures, uptime, power, GPUs alive, firmware, serial, fans, switch port
Controls start and stop per compute group, staggered, confirmed when 90 % of the group runs
Reads the demanded load as a binary, stepped or target-power signal
Controls translates the signal into the number of groups to run
Reads indoor and outdoor temperature, humidity, probes, wind, door, smoke, intake and exhaust airflow, kW, V, A, Hz, power factor, kWh
Controls nothing: safety logic stays in the PLC
Reads per outlet on/off, current and energy; per phase V, A, W, PF, kWh; unit online
Controls outlet on, off, cycle: opt-in per site, refused while a critical alarm is active
Reads power, mode, fan speed, setpoint, room temperature, filter, fault code
Controls nothing: the PLC owns the room
Reads run state, output Hz, A, kW, torque, speed reference, DC bus, drive temperature, trip code
Controls nothing: the drive is the PLC's actuator
Reads per-rack probe temperatures, observed relay contact
Controls nothing
Reads switches, access points and router: firmware, uptime, WAN latency, loss and rates, VLANs, port map with PoE, wireless roll-up
Controls nothing
Reads one still per camera every 45 s; people, intrusion, line-cross, tamper and motion events
Controls refresh a frame only
Reads fire, intrusion, tamper, mains, batteries, arm and disarm with user, hub heartbeat
Controls nothing: the protocol only acknowledges
Reads status, takeover, kW, per-phase V and A, fault flags
Controls nothing
Reads disk, CPU, RAM, temperature, buffer fill, backup note
Controls nightly encrypted off-site backup of identity, configuration and VPN keys
AI advises. AI never controls.
There is no AI in the control path: the orchestrator is deterministic, unit-tested code on the bridge. The AI layer does two things, and only when a person asks.
- Incident summaries on demand: what happened, when, the likely correlation, recommended first steps and the sources used. Written only when someone presses Analyse; the text never rides a mail or a Telegram message.
- Copilot for staff: read-only tools scoped to what the user may already see, sources listed under every answer. It cannot start or stop anything.
- Both are visibly marked as AI, carry a standing "verify before acting" disclaimer, and are cost-tracked per call against a monthly budget that switches them off when reached.
- Notifications never wait for the AI: mail and Telegram carry the measured facts and a link, immediately.
Built against what real devices answer.
| Compute | GPU servers and dense compute nodes over their local management API |
|---|---|
| Grid operator | Binary, stepped and target-power signals |
| PLC and sensors | Beckhoff PLC sensor read-out |
| Power | Rack PDUs over SNMPv3; outlet switching over SNMPv3 or Modbus TCP; DEIF loadbank |
| Climate | Air-conditioning units and frequency inverters over Modbus TCP or RTU-over-TCP with a configurable register map |
| Rack sensors | Shelly temperature probes |
| Network | TP-Link Omada Open API or SNMPv3; WireGuard or OpenVPN site tunnels |
| Cameras | RTSP stills, ONVIF events |
| Security | AJAX hub via SIA DC-09 (AES-128) |
| Cloud | PostgreSQL with TimescaleDB; Amazon SES mail; Telegram bot; Claude API for the advisory layer; S3-compatible off-site backups |
| Monitoring | JSON health endpoint for external uptime monitoring; in-app feedback that files issues with screenshots |
Per-node runtime balancing, power quality (harmonics, phase imbalance), push notifications, bounded setpoint control for air conditioning, a multi-container client portfolio with map view, automated monthly reports, a maintenance logbook and SLA reporting, hydro and immersion cooling telemetry, weather data for the exhaust, energy-price and grid forecasting, predictive thermal management and predictive maintenance. Listed as planned, not as available.